A Peltier device is a solid-state heat pump that transfers heat from one side to the other. This heat transfer simultaneously reduces the temperature of one side of the device and increases it on the other side, generating in this way a temperature gradient across the sides of the device.
Peltier cooling is not as efficient as vapor-compression refrigeration, but Peltier devices have the advantage of being small, having a long life and no moving parts, making no noise and able to switch from cooling to heating.
In this post I will characterize a Peltier module with a source measure unit (SMU) and a temperature sensor.
Heating/Cooling System
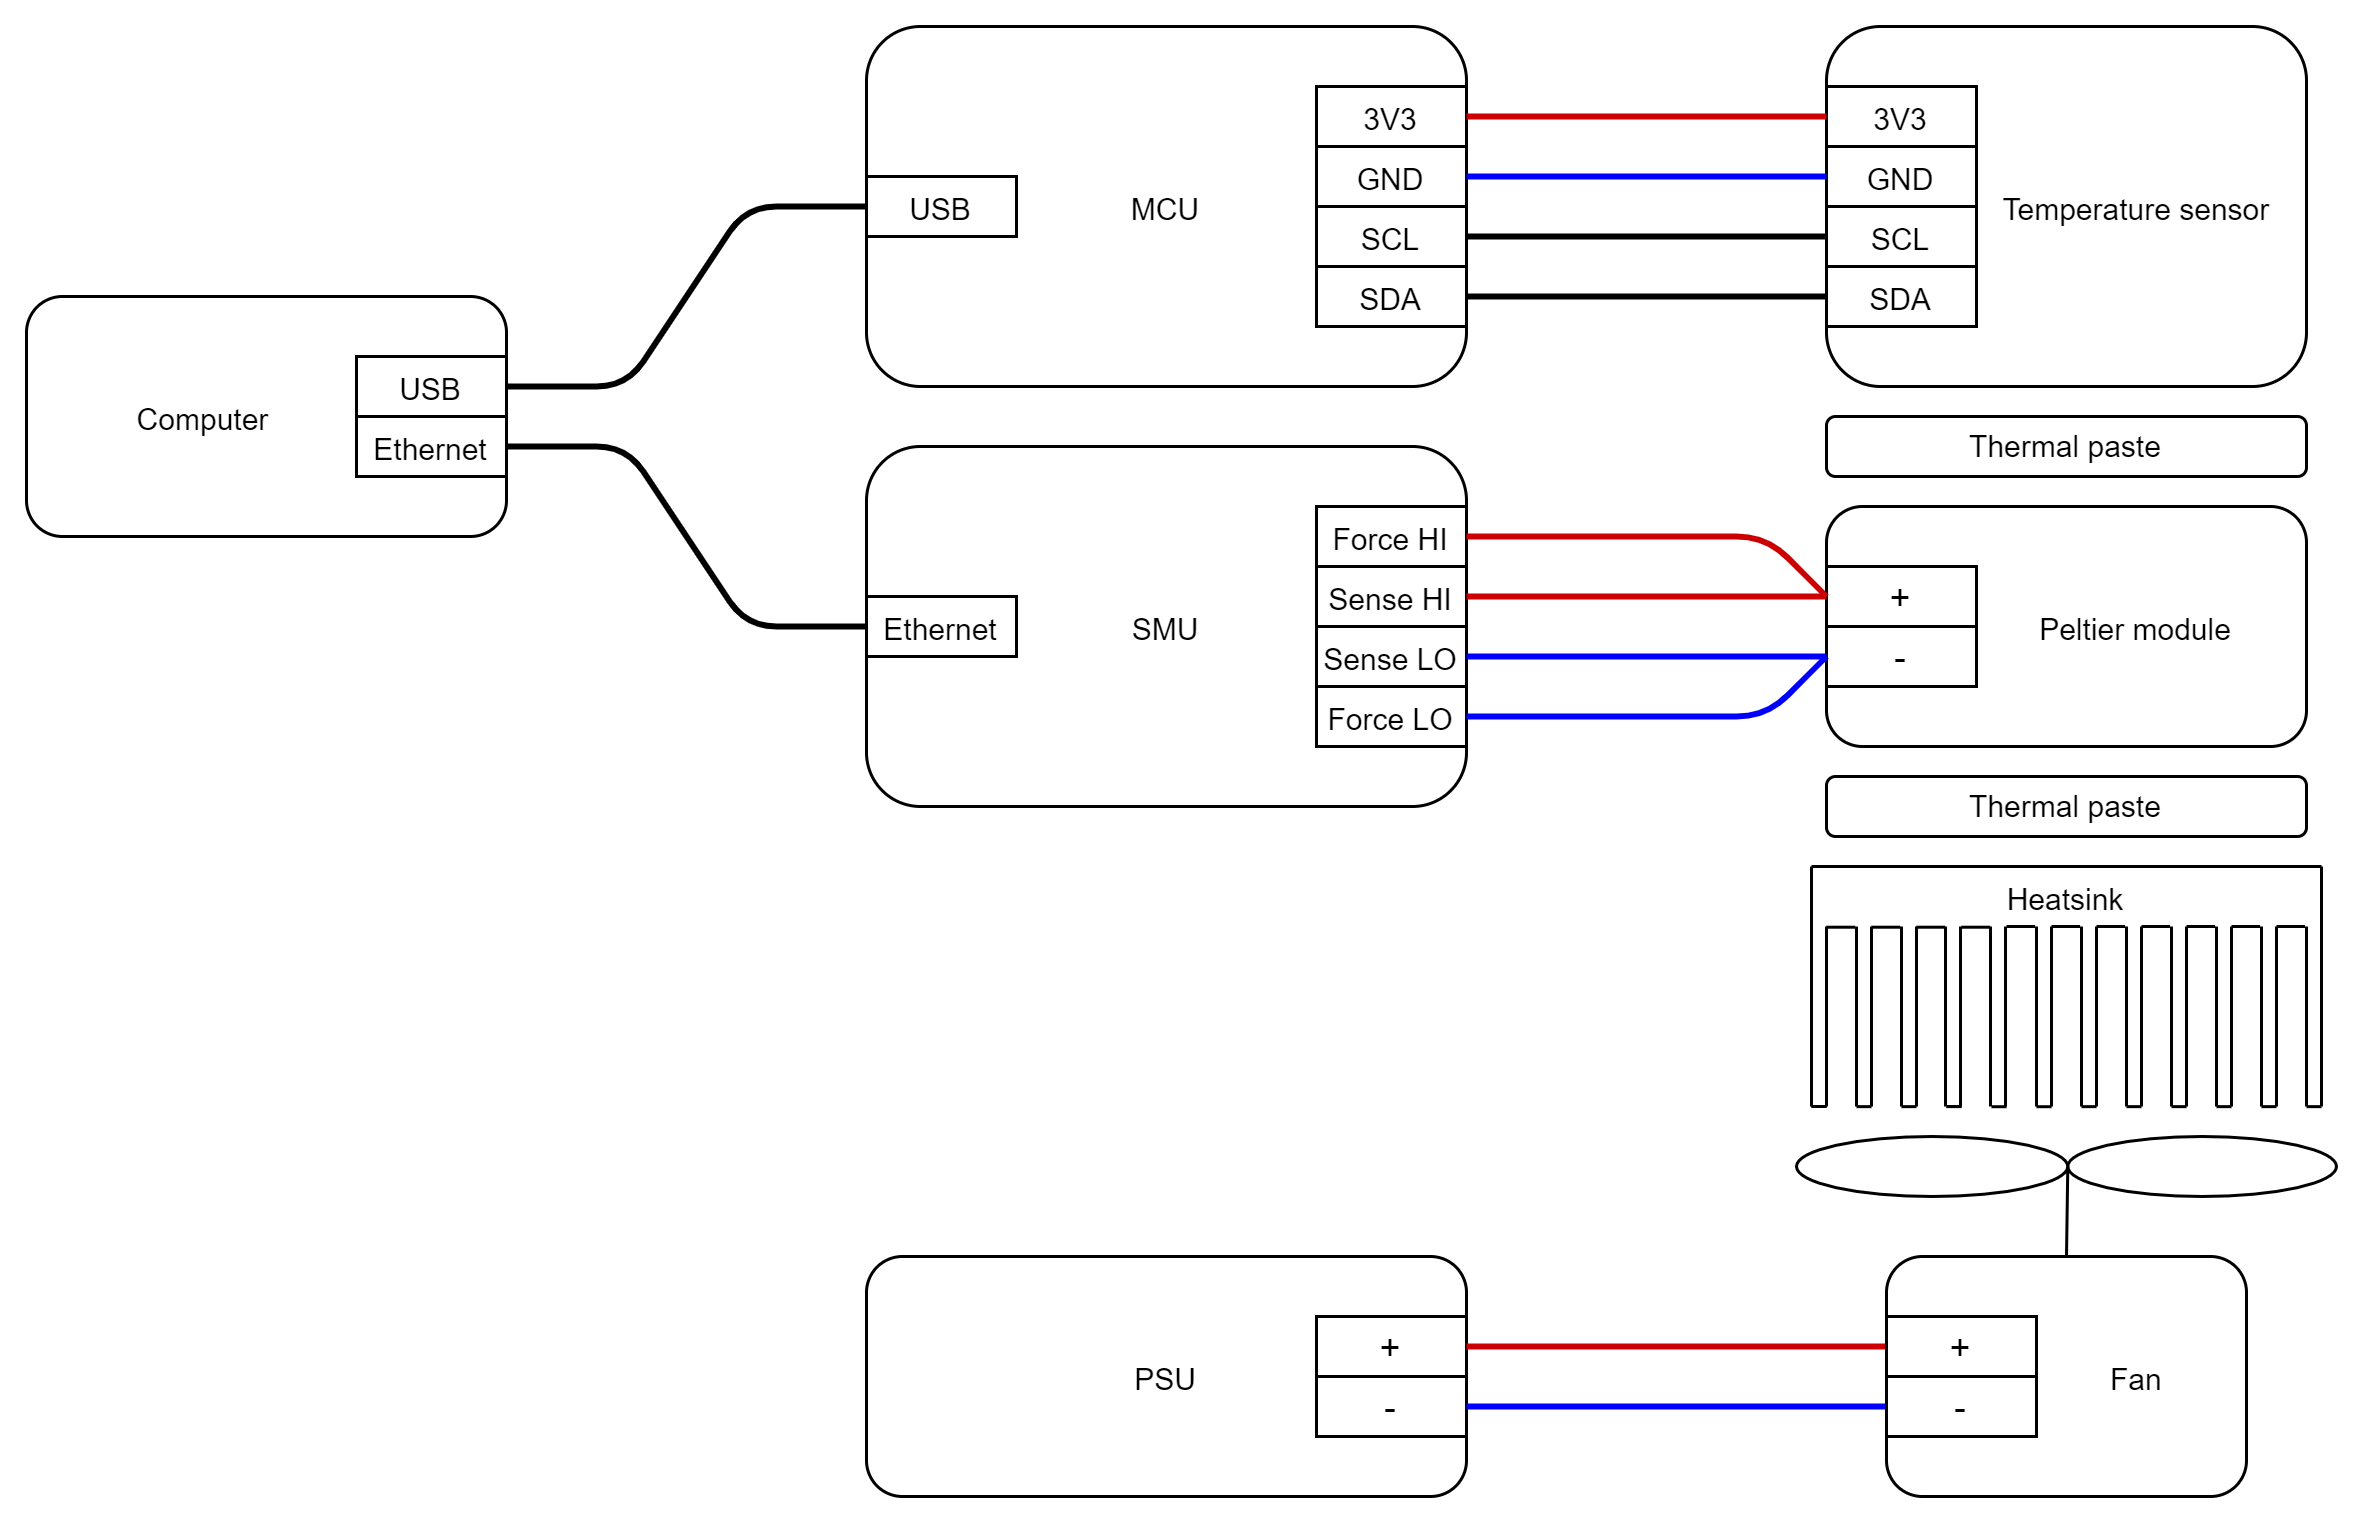
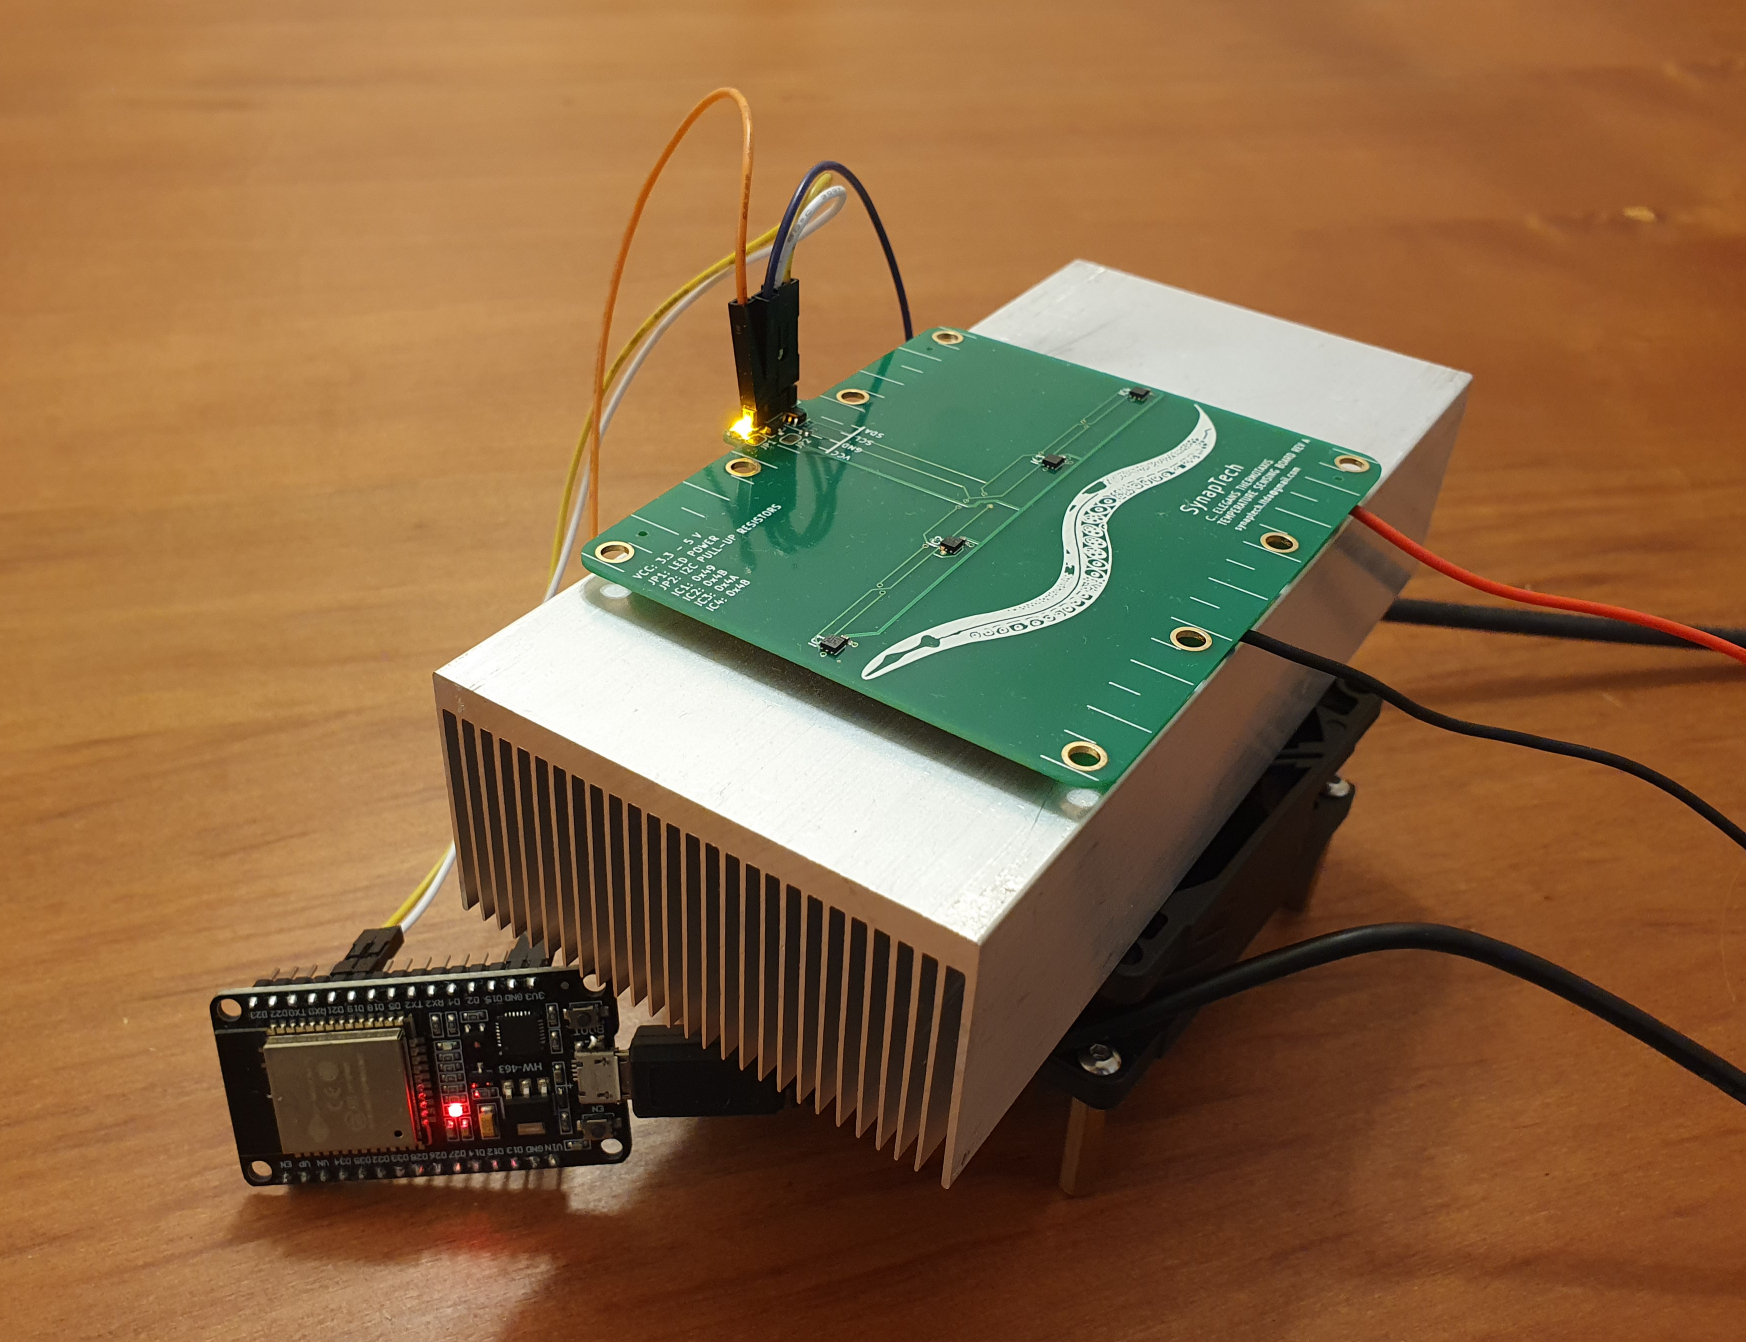
The system is made of a Peltier module sandwiched between a heatsink and a temperature sensor board. The temperature sensor board (built for a C. elegans neuroscience lab) uses 4 TI TMP116N temperature sensor, but only the sensor centered in the middle of the Peltier module was used to make the measurements. One side of the device was kept close to ambient temperature through forced convection. I used an Espressif ESP32 to read the temperature from the board and transmit it through a virtual serial port to a computer.
The setup looked like this:
Heating/cooling system wiring diagram
Heating/cooling system wiring
I/V Curve tracing
When tracing I/V curves the speed of the sweep can have a major impact in the results. If the sweep causes the device under test (DUT) to raise its temperature, the resulting measurements can be completely different than if the temperature is not affected during the sweep. To avoid raising the temperature, the sweep must be pulsed or done in a very short time to avoid injecting too much heat into the DUT.
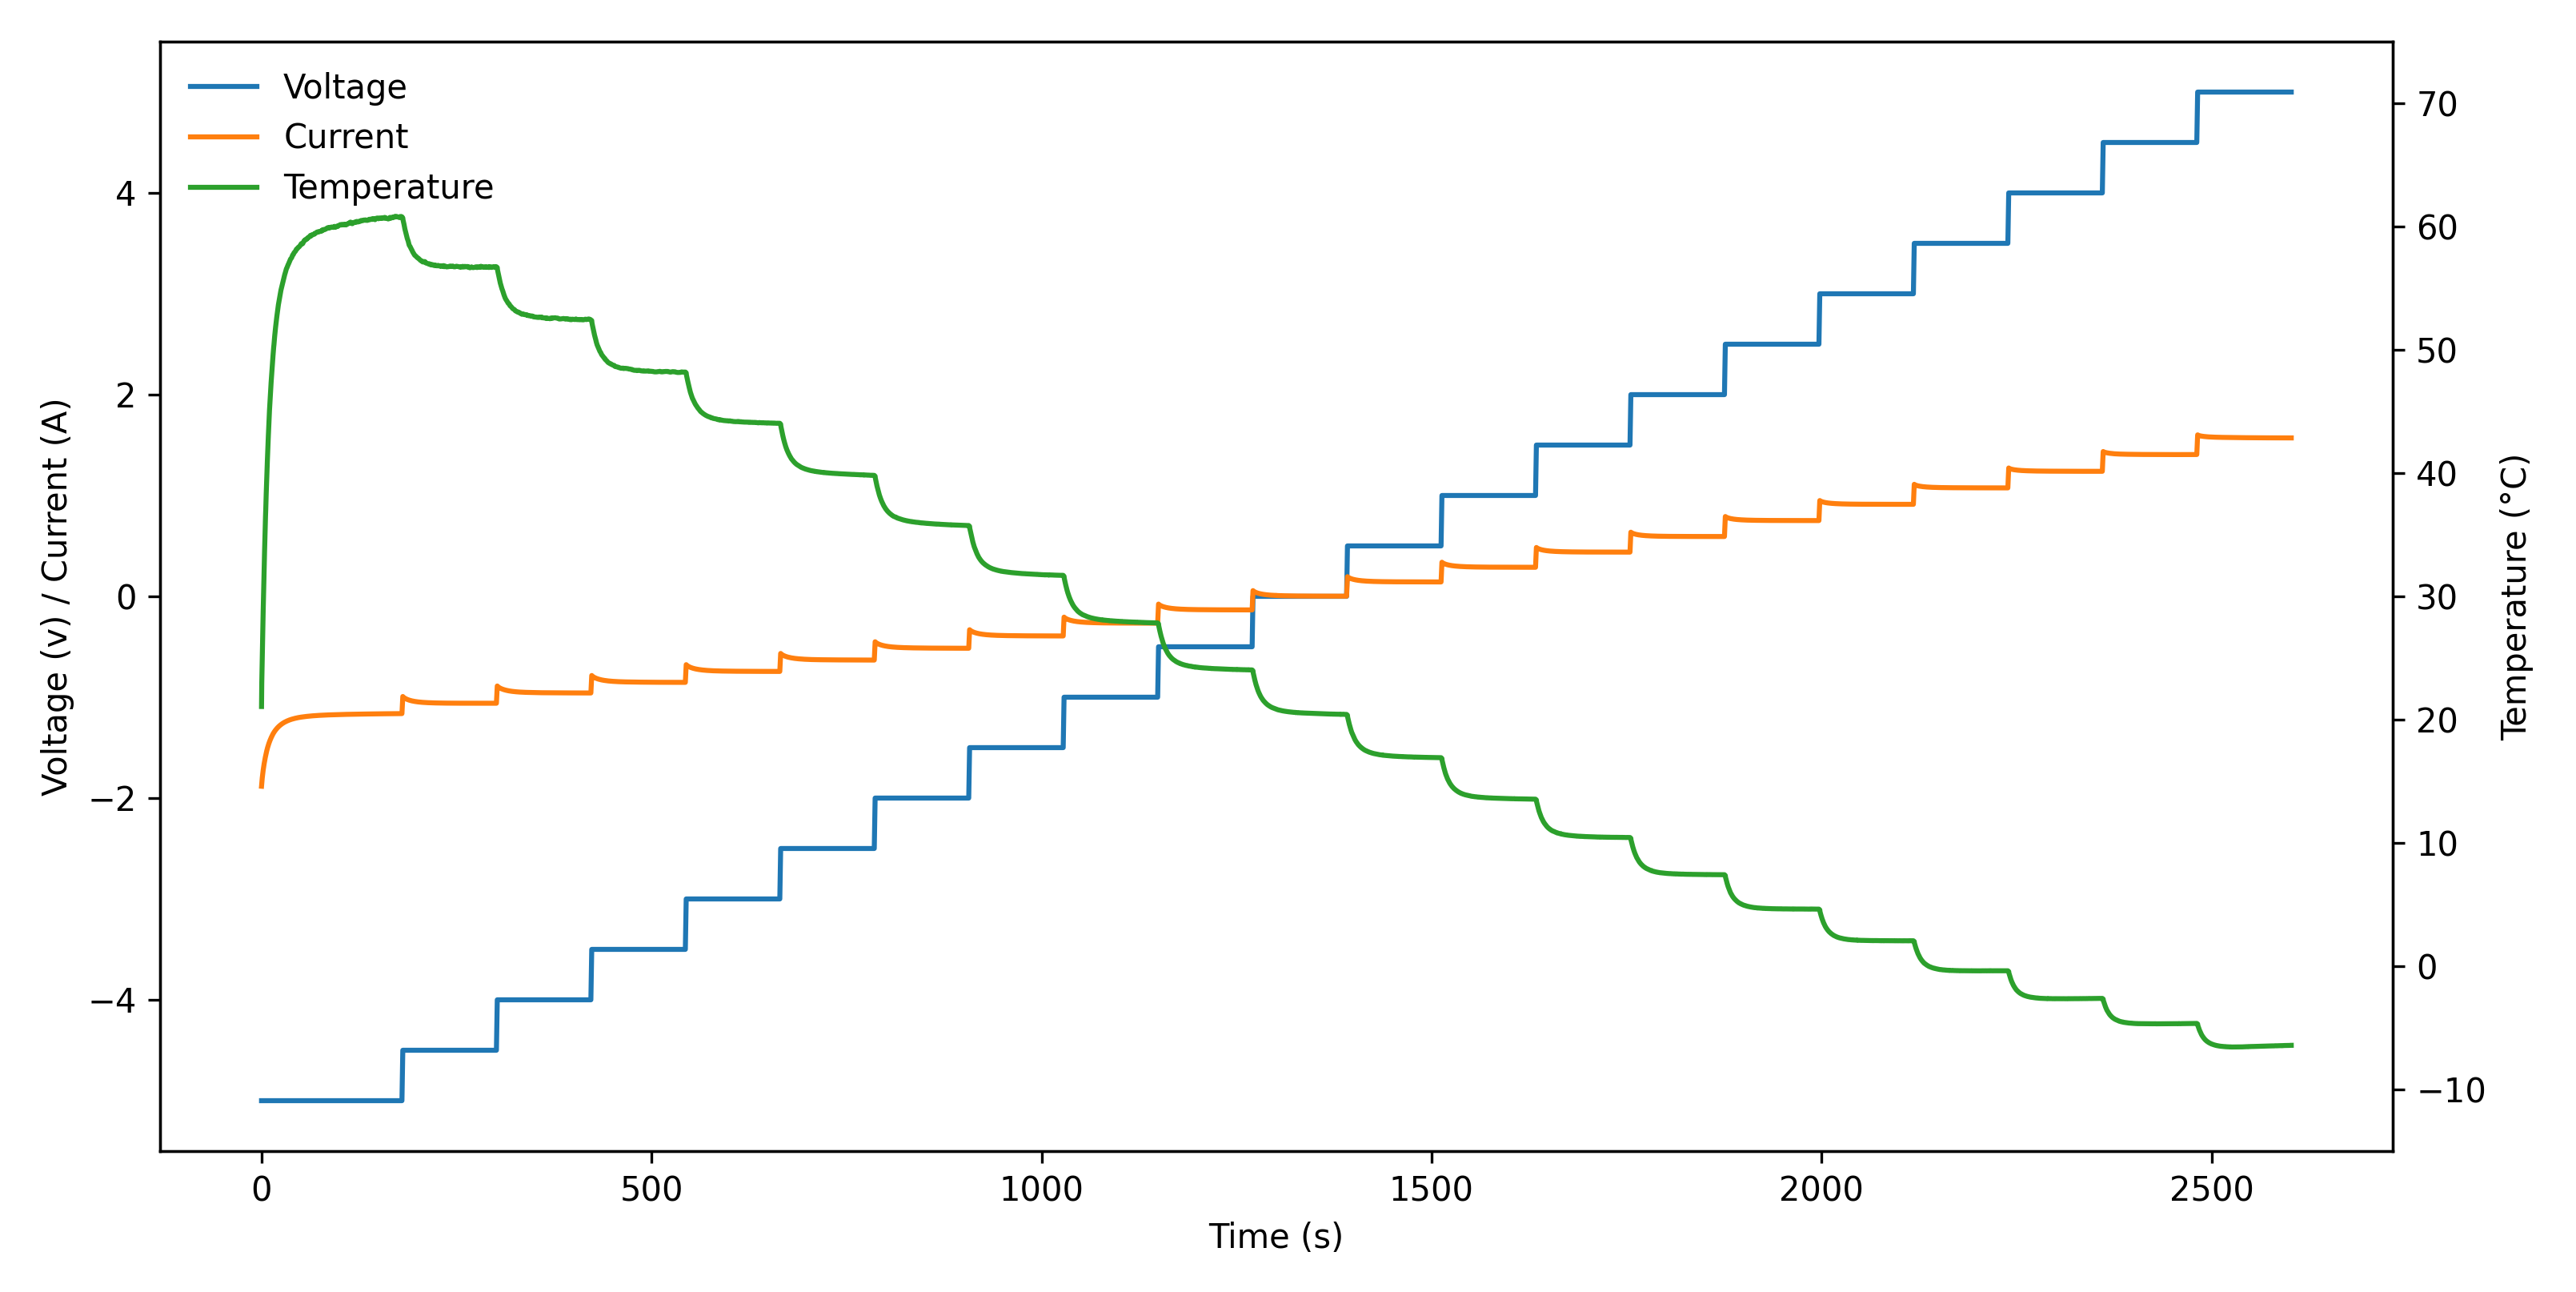
To compare the effect of temperature in the I/V curve I performed a stepped constant voltage (CV) sweep and a pulsed sweep, while simultaneously recording the temperature. The CV sweep was made of 21 steps of 0.5 V each, from -5 V to +5 V. Steps of 2 min and 3 min (at the initial step) were used to make measurements in a more or less temperature steady state condition. For the pulsed sweep I generated 1 ms pulses followed by rests of 1 s between pulses. Measurements were made at 500 ksps (the fastest speed supported by the Rhode & Schwarz NGU401).
The next images show the measured raw data:
Constant voltage time series
Pulsed voltage time series
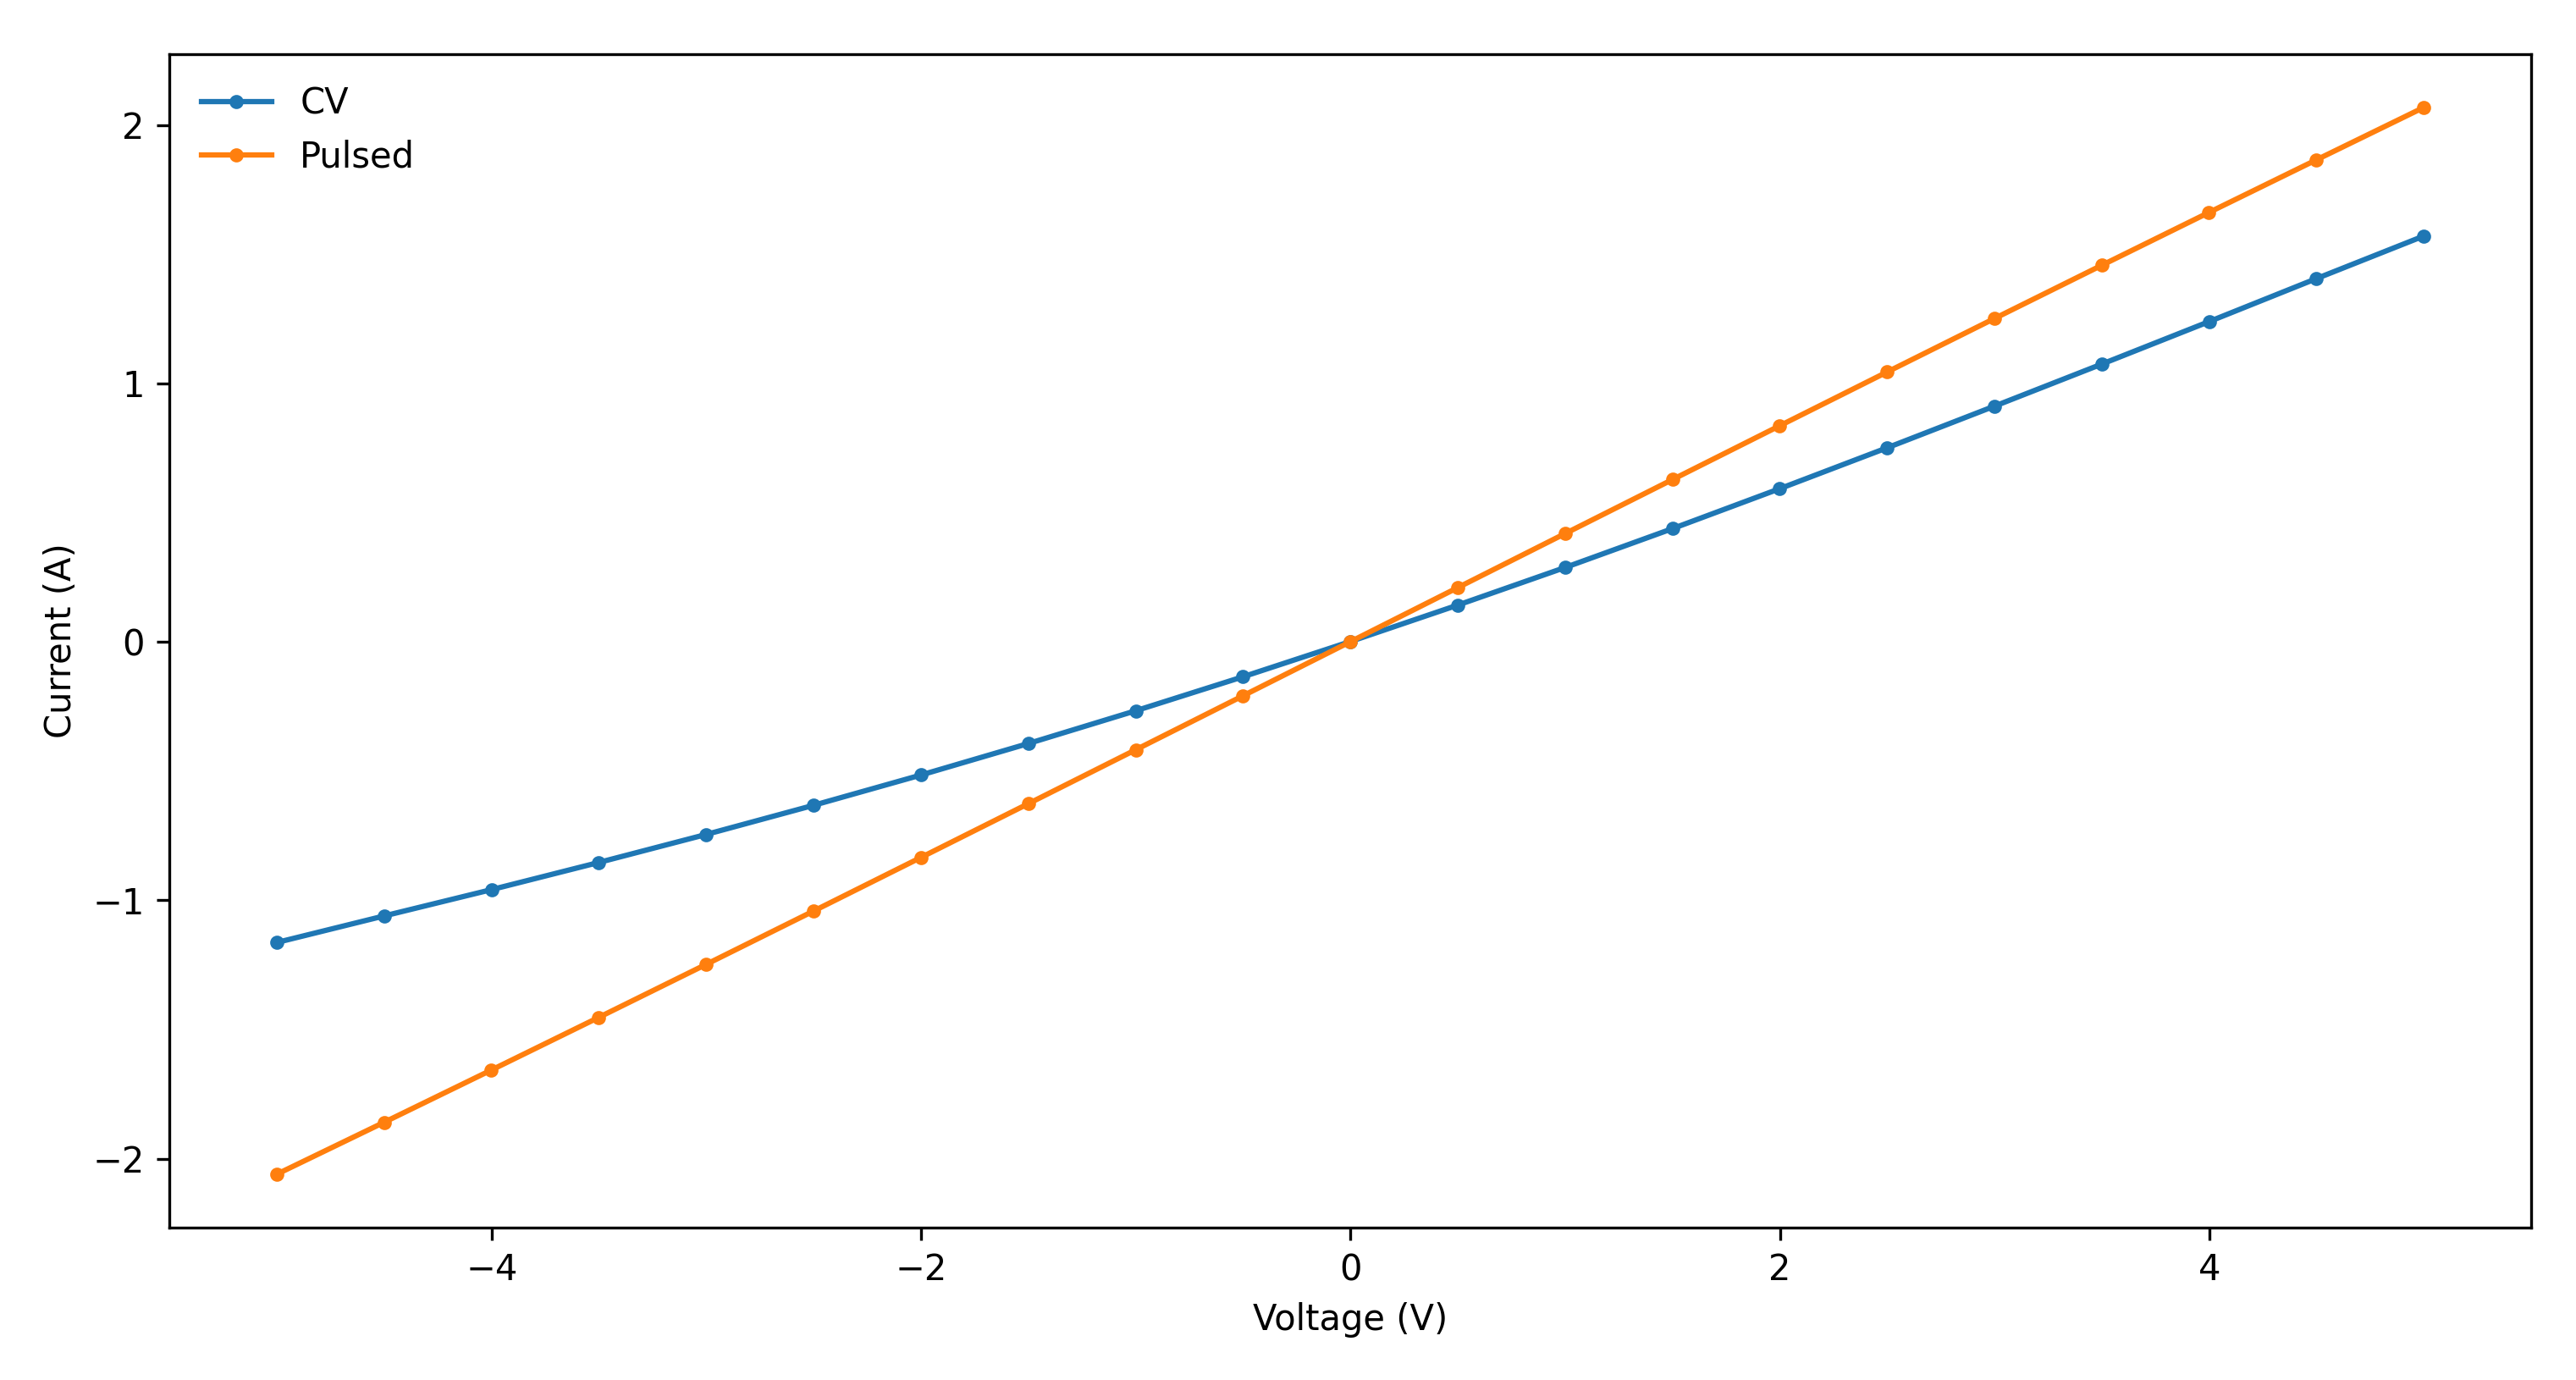
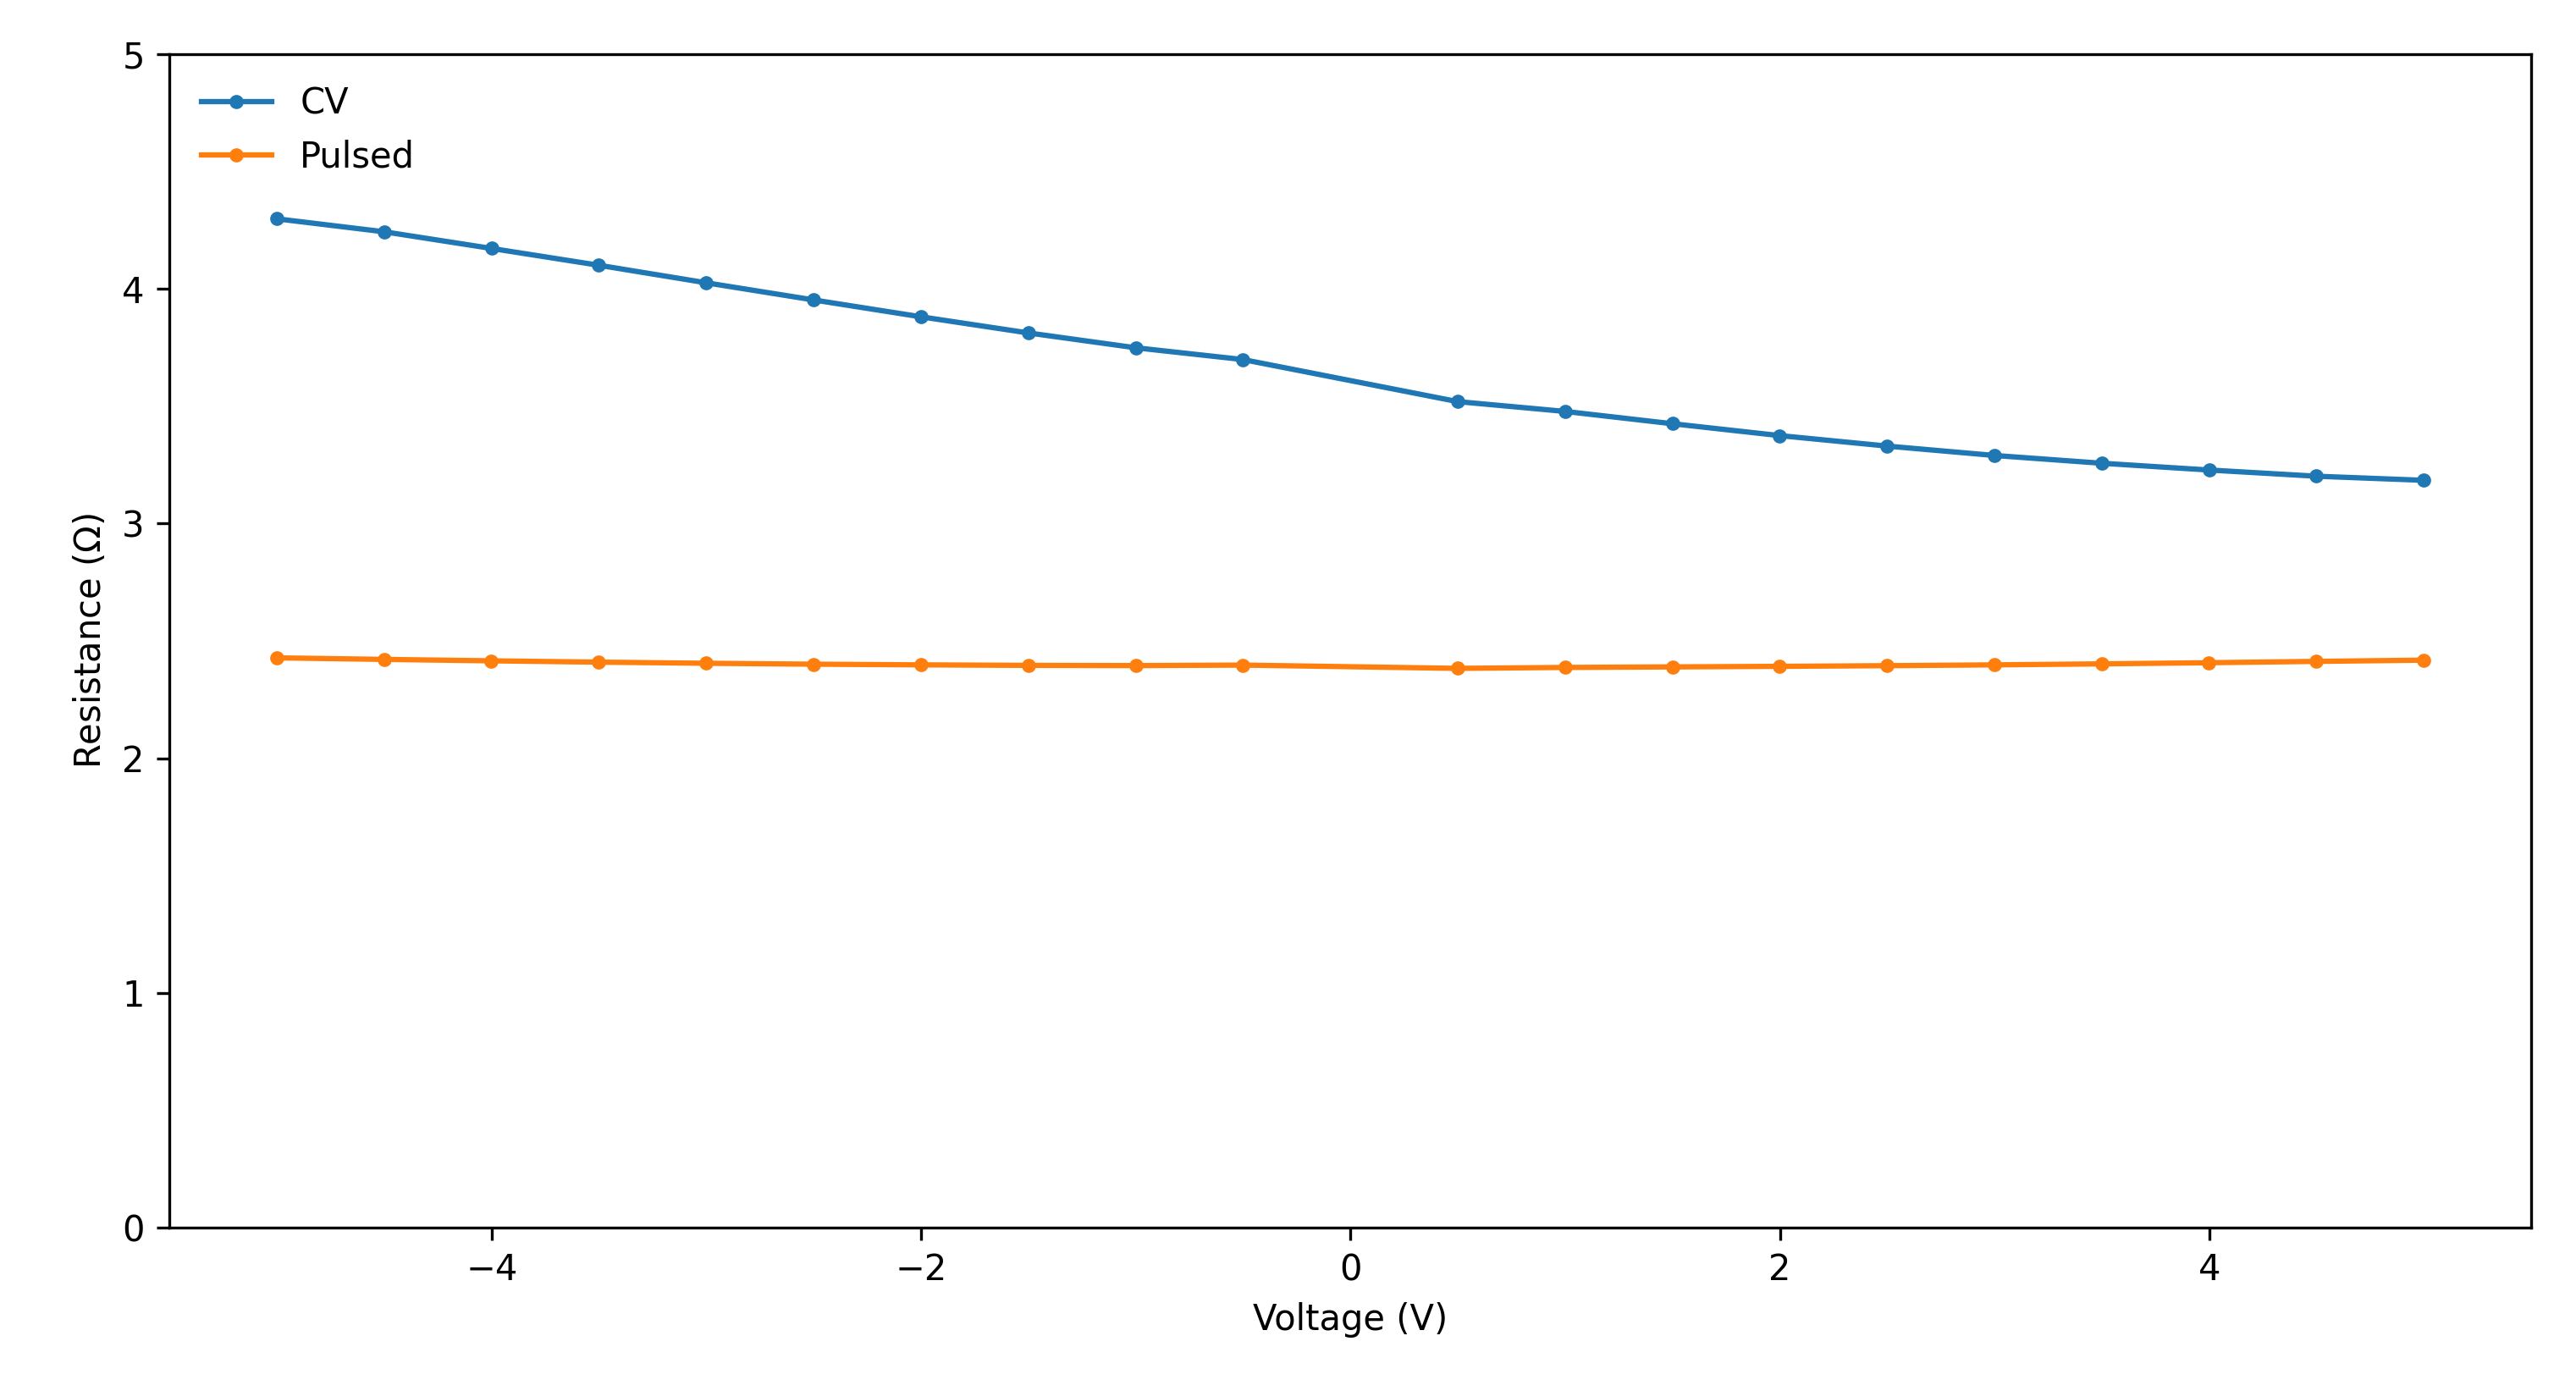
To generate the I/V plot I averaged the last 2 seconds of each step, and the 0.5 ms of the mid section of each pulse. As both curves looked very close to straight lines, I also generated a resistance plot.
Peltier I/V plot
Resistance plot
The plots show that when both sides of the Peltier module are at ambient temperature, it functions like a resistor with a resistance of approximately 2.5 Ω. However, when a temperature gradient is present across the module, the resistance increases, regardless of whether the measured side is hotter or colder than the ambient temperature.
Efficiency
A simple and inexpensive way to drive a Peltier module is with PWM signal, but this is usually not advised when efficiency is important. A recent Texas Instruments’ application note measured the ability of a Peltier device to generate a temperature gradient when driven with 20 kHz, 50% duty cycle PWM current, compared to constant current. One limitation of Texas Instruments’ tests is that they did not try other duty cycles, so I was interested in measuring how different duty cycles affect the efficiency.
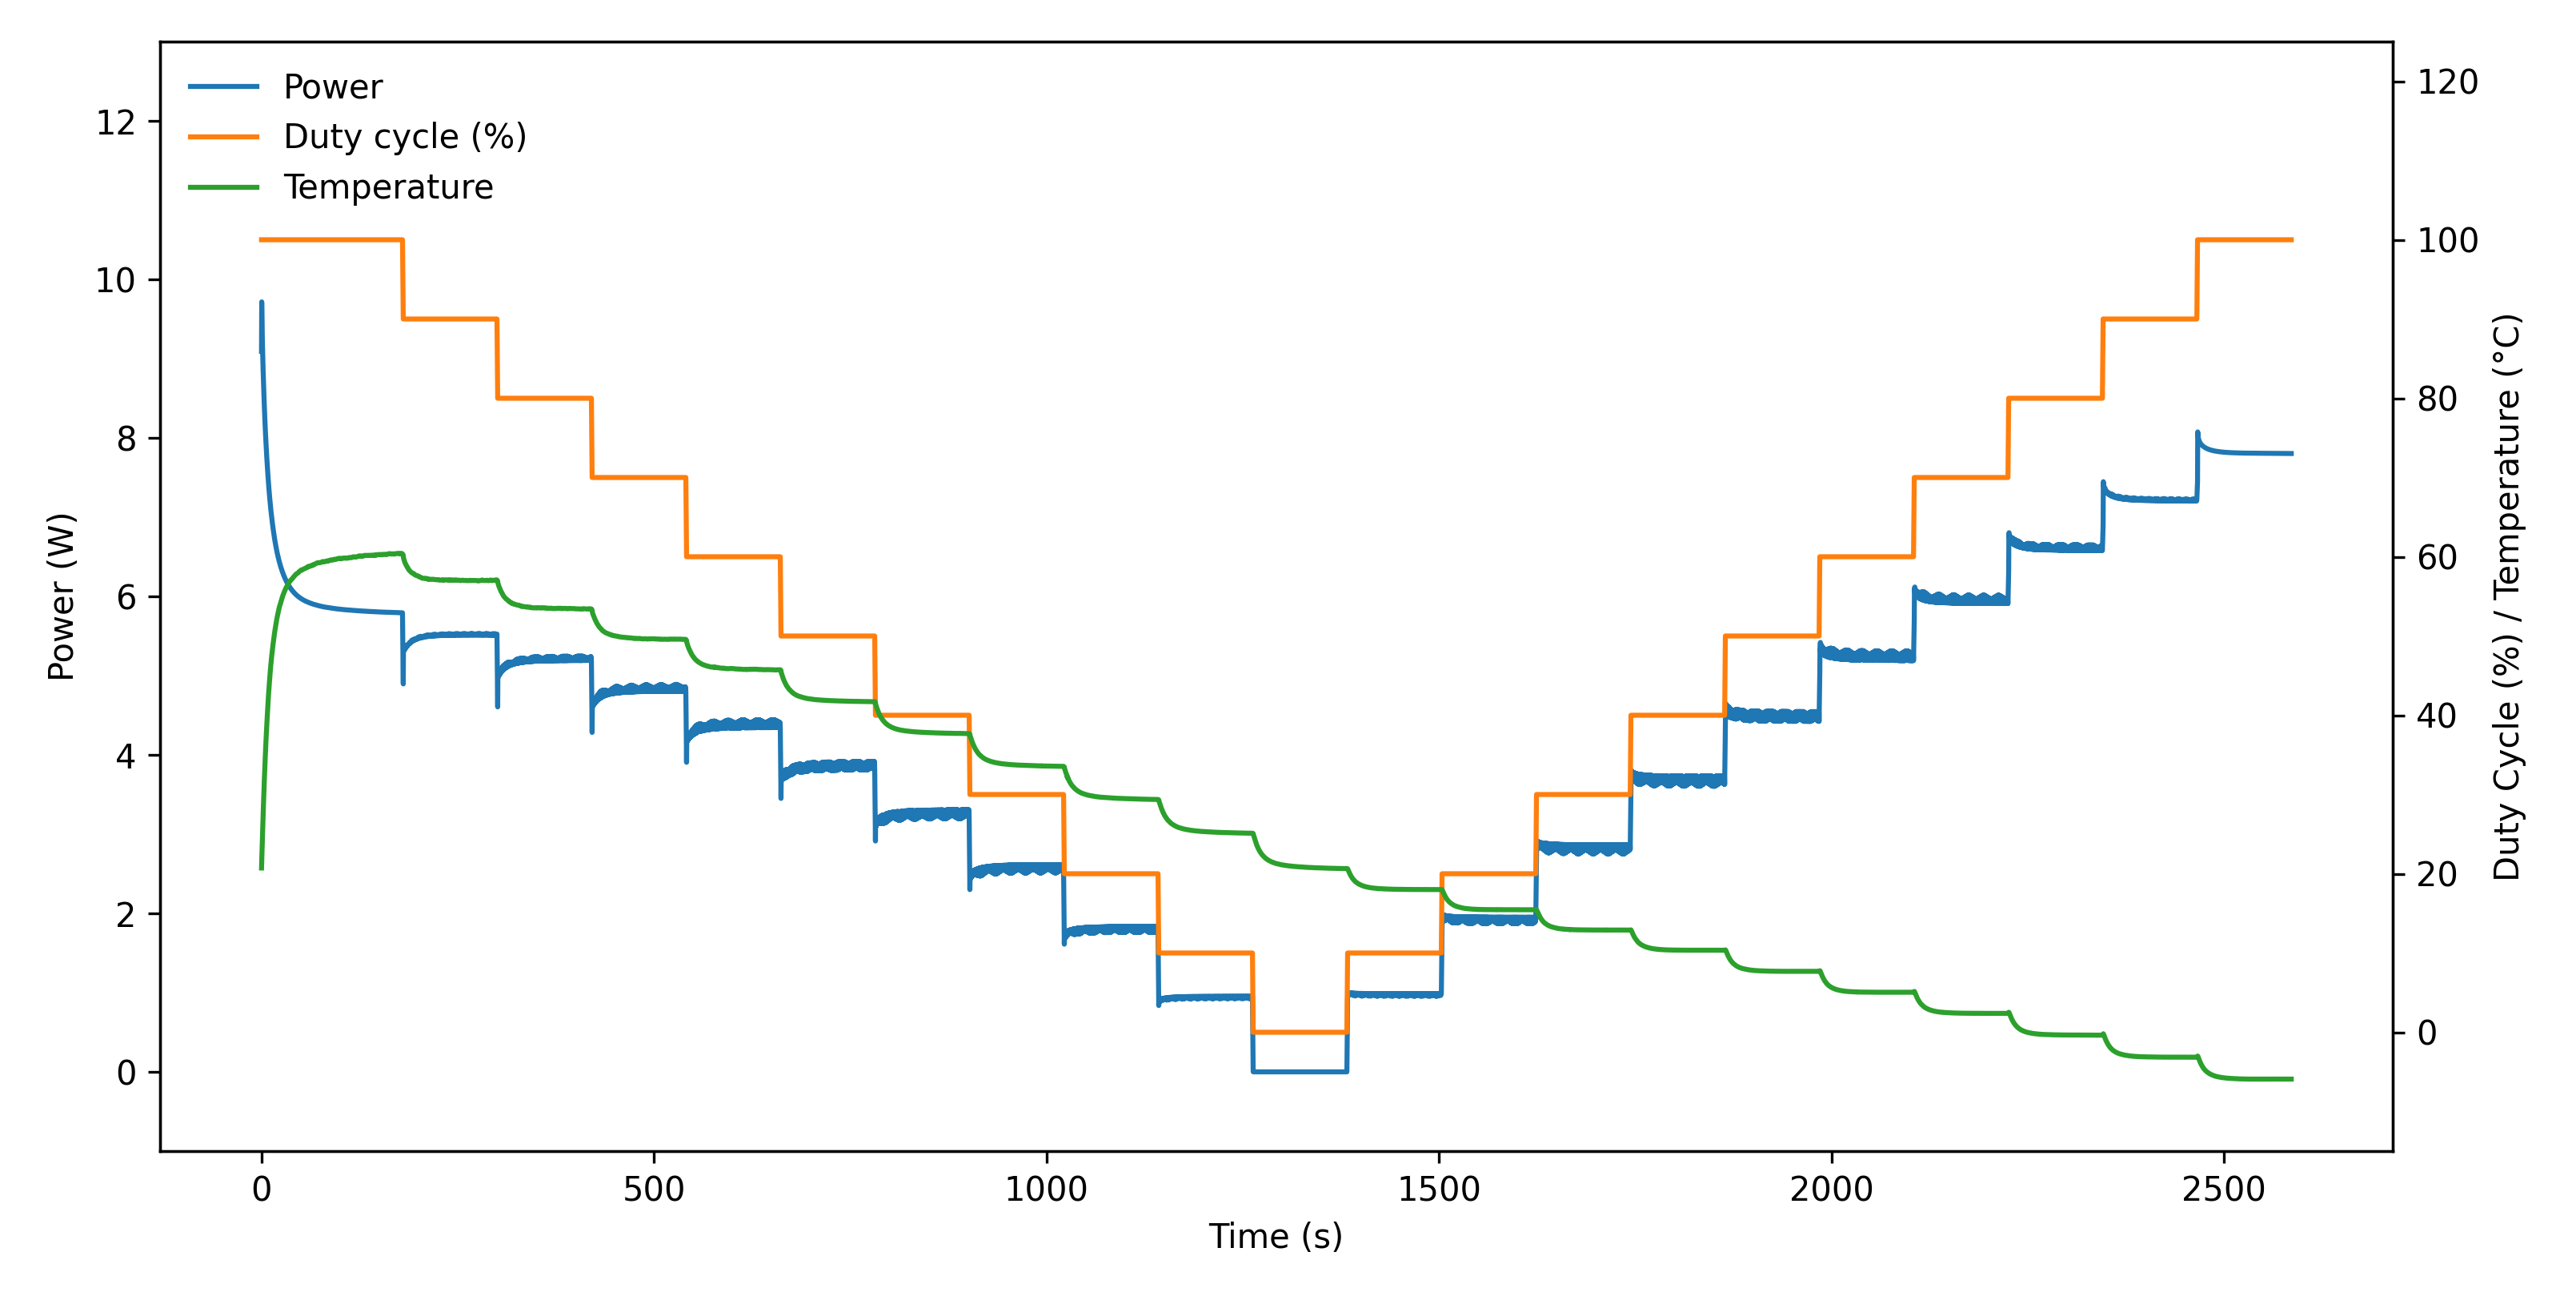
I decided to use a relatively low PWM frequency of 100 Hz, and performed a sweep from 100 % duty cycle (inverted polarity), to 0% duty cycle, to 100 % (non-inverted polarity). The SMU generated the PWM signal and sampled the I/V response at 500 ksps. Just like in the previous CV sweep, the first step had a duration of 3 min, while the rest only 2 min.
PWM voltage time series
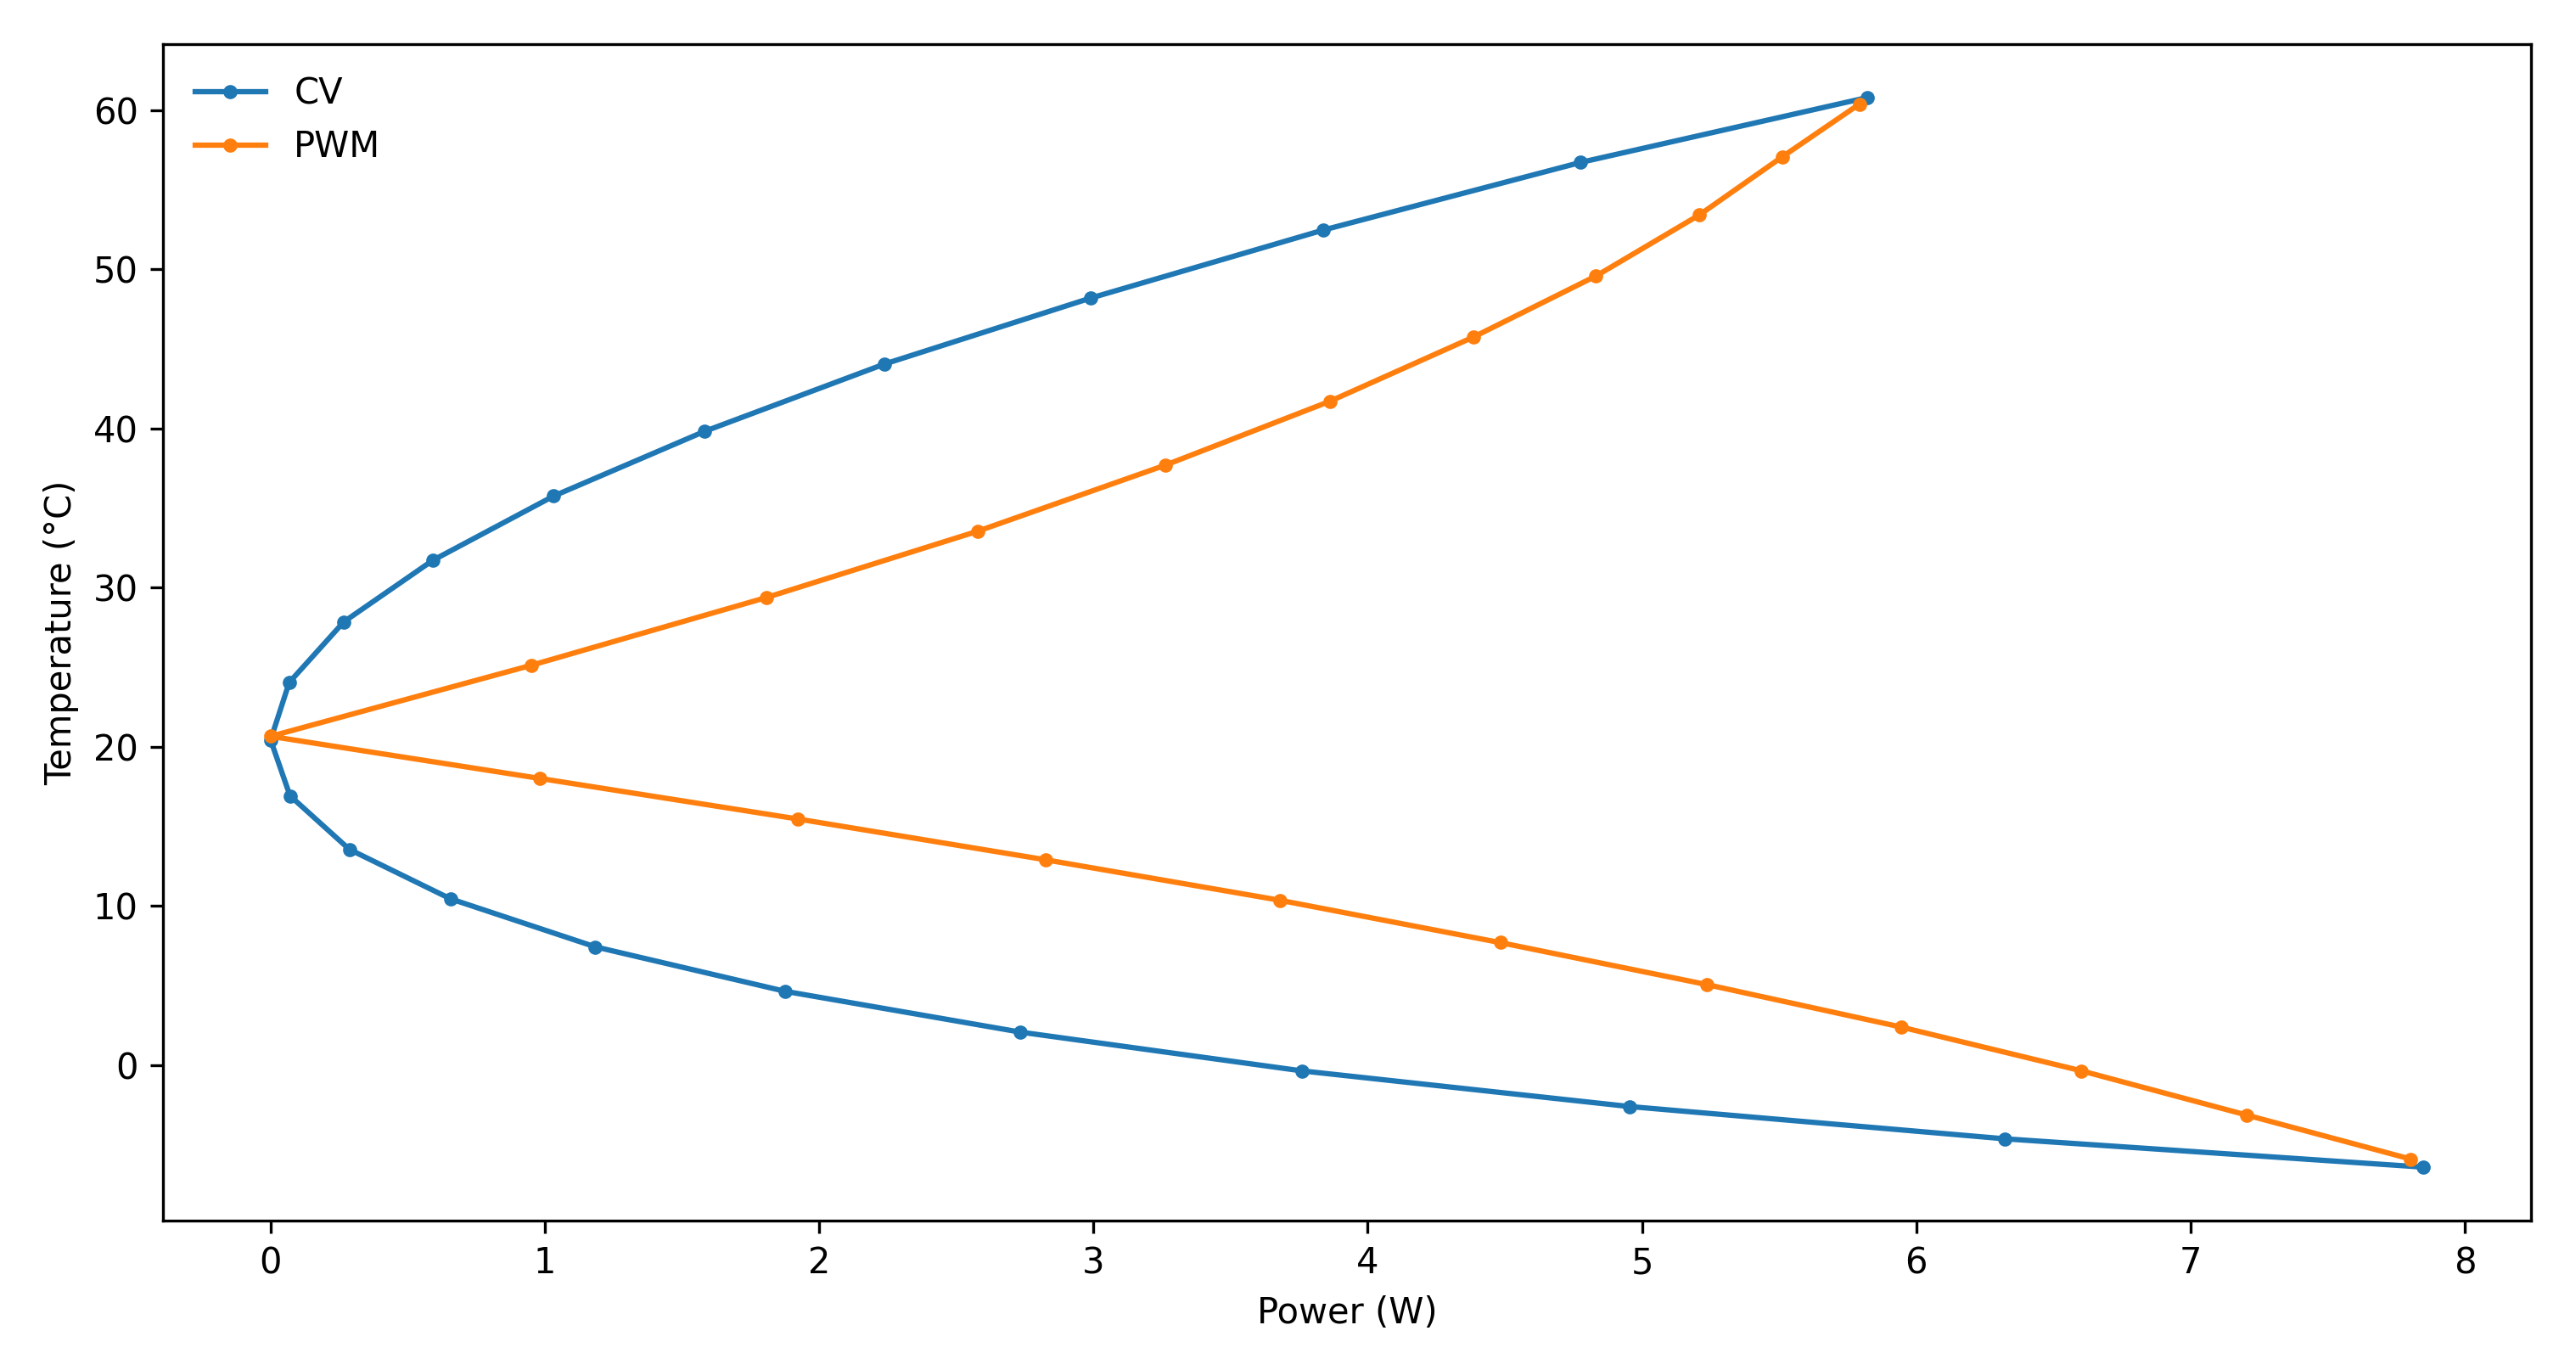
The efficiency plot was then generated averaging the last 2 seconds at each step, of both, the CV sweep and the PWM sweep .
Peltier efficiency
As expected, at duty cycles of 0% and 100%, the PWM and CV signals produce the same result as the signals are identical. At very low power, the difference seems to be the biggest, for instance at ~70 mW CV can cool ~3.5 ºC, while at ~980 mW PWM can cool only ~2.6 ºC. CV is also much more efficient than PWM when heating, but the difference tends to be lower than when cooling. For heating and cooling, as the duty cycle reaches 100%, the differences between CV and PWM shrink. It is also interesting to see how much easier is to heat than to cool, lets take look at what can be achieved with a power budget of 5 W. It can cool ~23.1 ºC (CV) and ~14.8 ºC (PWM), and heat ~37.2 ºC (CV) and ~30.6 ºC (PWM).
Conclusion
Electrically, Peltier devices operate almost like resistors, and this makes them simple to drive. On the other hand, the heating/cooling capability of Peltier systems depend on various factors such as the driving method and the heat transfer direction. This makes it hard to estimate the electrical and Peltier device requirement for a system to reach the desired temperature.
It is common knowledge that driving Peltier modules with PWM is not efficient, but there is little information available on how inefficient it is compared to CV driving. Here I compared both driving methods and found that the driving method has a huge impact in the efficiency, still depending on the application, this may not be important at all when designing a new system.